Introducing Silent Push 'Total View': a one-stop CTI homepage for security teams and brand defenders

Table of contents
What is Total View?
The Silent Push Total View screen provides end-to-end analysis of a domain or IPv4 address in a single screen, at the click of a button, without the need to perform additional DNS (dangling records, subdomains etc.), infrastructure (associated ASNs and nameservers), feed-based or web content pivots.
Total View enhances the enrichment function by displaying 100+ pivotable IOFA data points related to a single domain or IP, and presenting key DNS datasets alongside Live Scan and Web Scanner data to provide all the context security teams need to quickly establish the origin, function and risk level of a piece of infrastructure – be it known or unknown.
Sign-up to Community Edition to access Total View
The Total View screen is available free of charge through a Silent Push Community Edition subscription (as well as a Professional and Enterprise subscription).
Why is Total View useful?
The Total View screen consolidates 10 different Silent Push queries, scans and proprietary features into one screen, providing a central command console that acts as the first port of call for offensive and defensive operations, across a range of CTI job roles.
Total View doesn’t limit output to realtime intelligence data. When you enrich a domain or an IPv4 address, you’re also receiving a wealth of historical data related not just to your chosen observable, but the infrastructure it’s hosted on, including risk scores, the likelihood of an ASN, nameserver, or associated domain being involved in malicious activity, and where that activity is occurring.
All of this data is delivered via an intuitive UI, that reveals the biographical story behind a piece of observable data, allowing teams to make highly-evidential CTI decisions, and adjust their detection/blocking mechanisms and IR activities accordingly.
Accessing Total View
To access Total View, enter a domain or IPv4 address into the top search bar and click Enrich. You’ll then be presented with the main Total View screen.
Total View has two key sections – Highlights, and Contextual Data. Let’s take a look at each one in turn.
Total View Highlights
The Highlight section is just that… an at-a-glance run down of key data types that we think you’d like to know about.
For demonstration purposes, we’ve used pokerpalacehotel[.]com – a malicious domain associated with the FIN7 group.
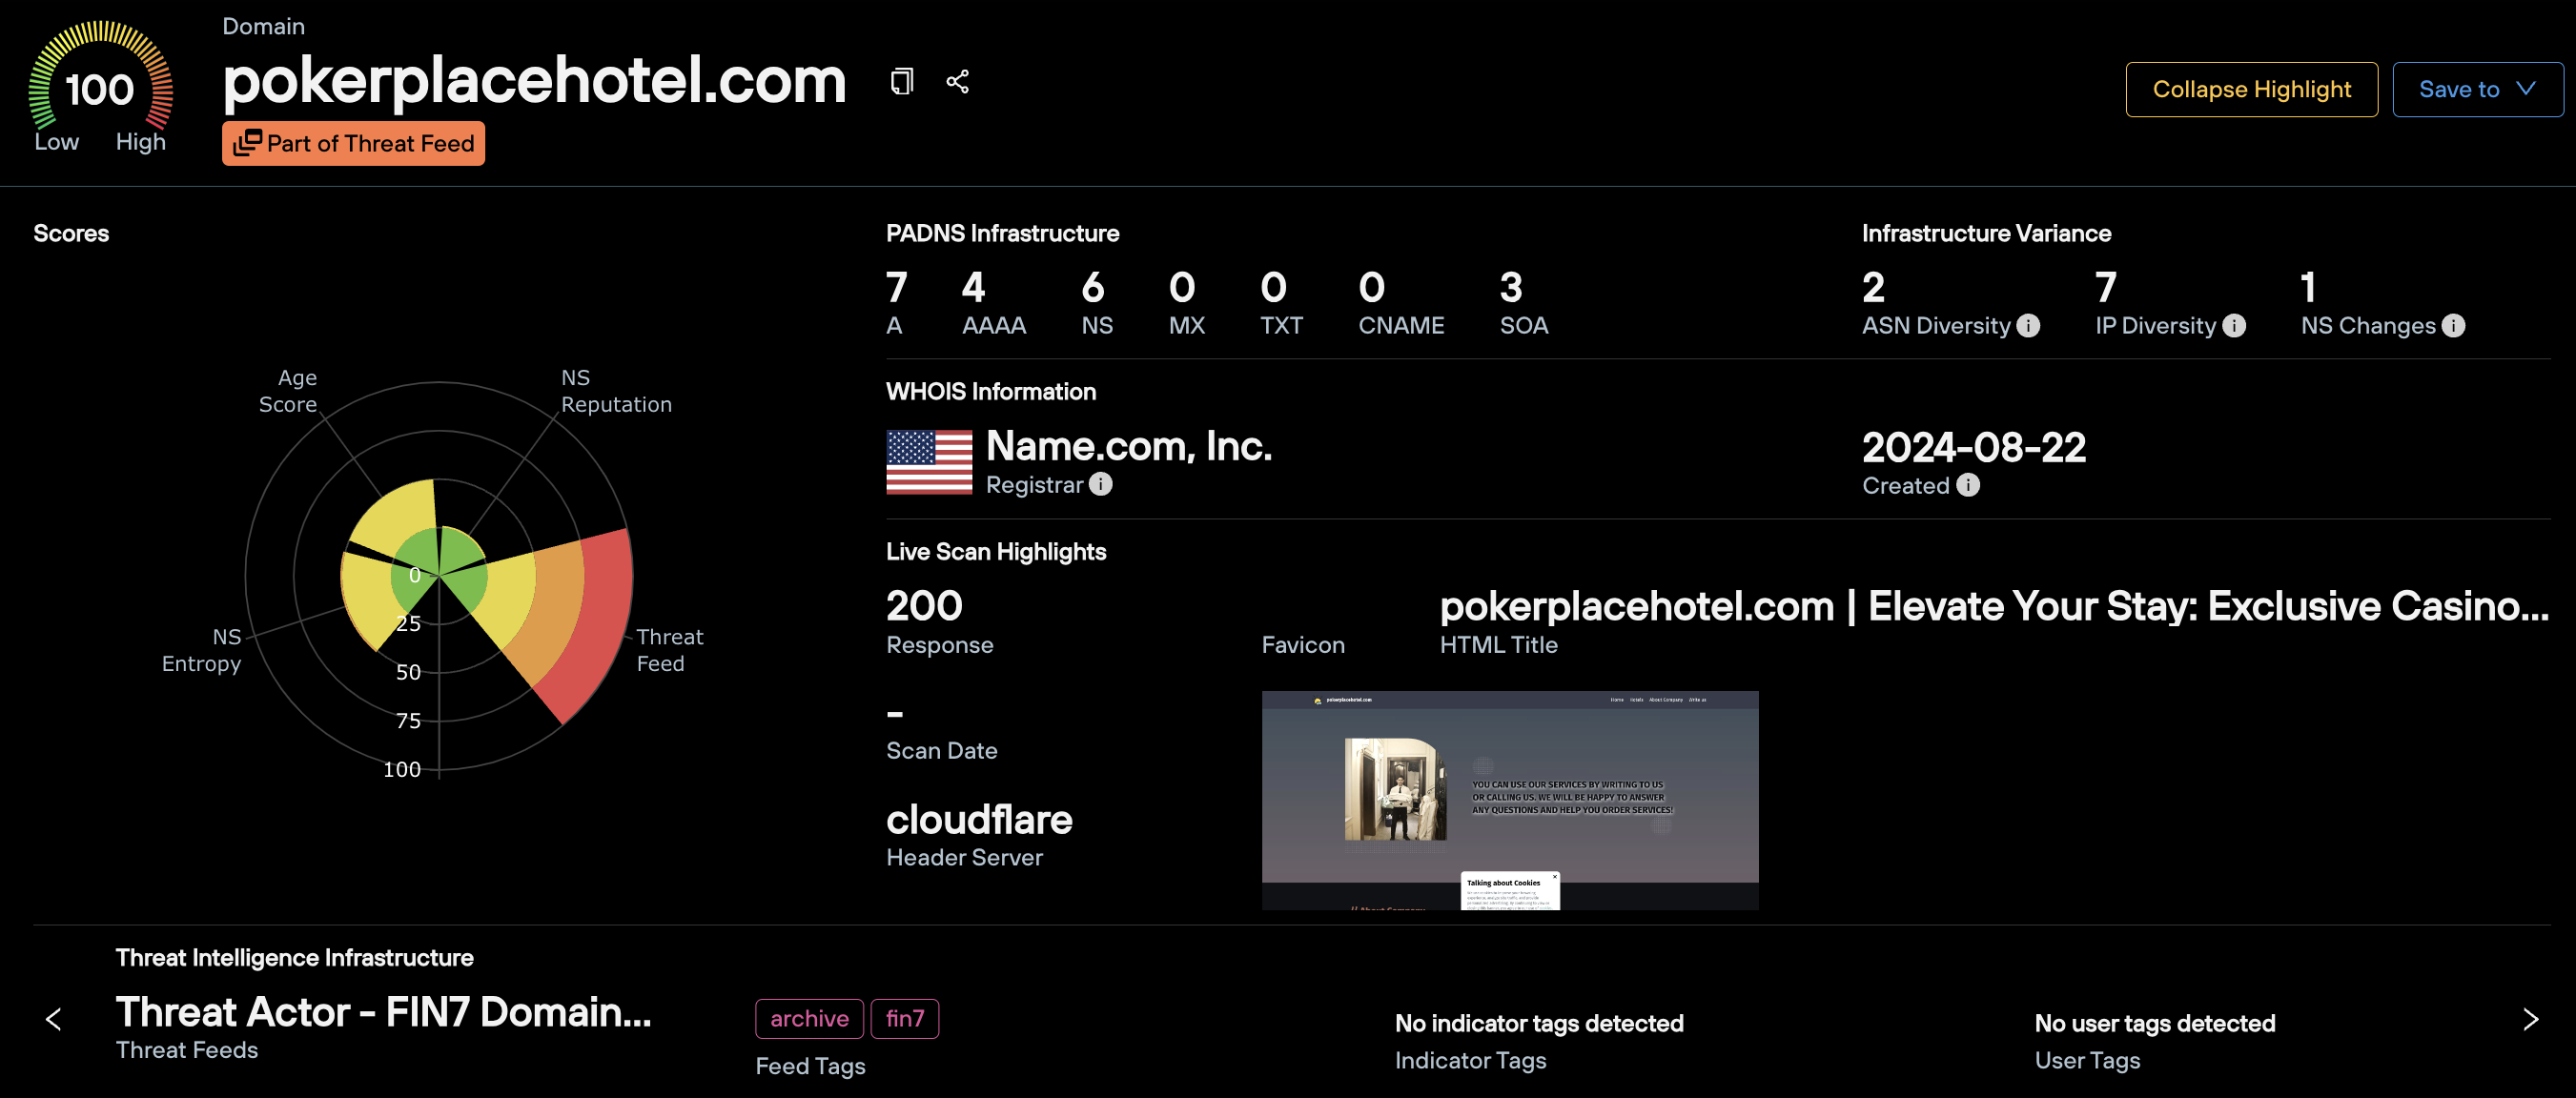
In this section, you will find:
- The Silent Push Total Risk Score, along with the underlying mechanisms we’ve used to arrive at that score. In the above example, you can see that the domain carries a score of 100 due its true positive presence in an active threat feed.
- A clickable count of all DNS records associated with the observable, including current and historic
- WHOIS information, including the registrar and create date
- Key Live Scan data, including the HTML response, favicon, real time screenshot, scan date and header information
- Any threat feeds the observable currently resides in
- Infrastructure Variance metrics… more on these key data points later
You can also use Total View to enrich an IPv4 address, and be presented with data categories relevant to an IP, rather than a domain.
In the Highlight section, this means you get all of the above data minus the WHOIS highlights, given that WHOIS data only relates to domains, not IP addresses.
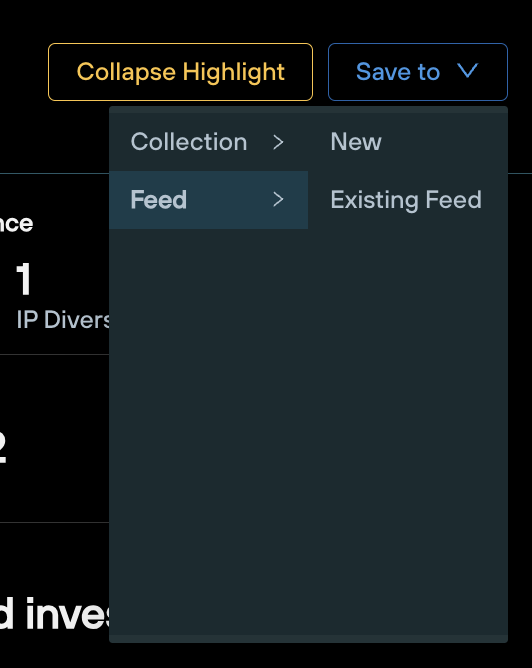
From the Highlight section, you can save the observable to a new or existing feed, using the drop-down menu on the top right.
Total View Contextual Data
Below the Highlight section, you’ll find a table containing comprehensive contextual datasets that fulfil the main use cases of the Total View screen, comprised of 10 distinct queries and scans found elsewhere on the Silent Push platform.
To centralize intelligence gathering, each function is accessed as a tab from a single static table, preventing the need to navigate away from the page to gain additional context.
Let’s use the same FIN7 domain – pokerpalacehotel[.]com, and see what’s on offer from the tabbed menus above the main table.
Note: Any piece of data displayed in blue on the Total View screen can be pivoted on. Left-click the data point to bring up a contextual menu that allows you to perform forward and reverse lookups, based on the data type in question.
1. PADNS
Query: Domains and IPv4 addresses

The PADNS menu displays all the passive DNS data Silent Push holds on your chosen domain or IP address, including SOA records.
Results are broke down by record type, with a range of forward and reverse lookups available for hostnames, IPs, ASNs and associated DNS records, including reverse lookups on nameserver hashes.
2. Infrastructure Variance
Query: Domains only
The Infrastructure Variance tab allows you to gain a top-down view of how a domain has moved across different infrastructure sets (ASNs, hosting IPs and nameservers) over time, including the trustworthiness of those infrastructure sets, and the frequency of any hops.
The ASN tab contains a list of historical ASNs associated with the domain, and ability to enrich each ASN with a one-click pivot, to gain additional intelligence including associated subnets and the ASN’s takedown reputation

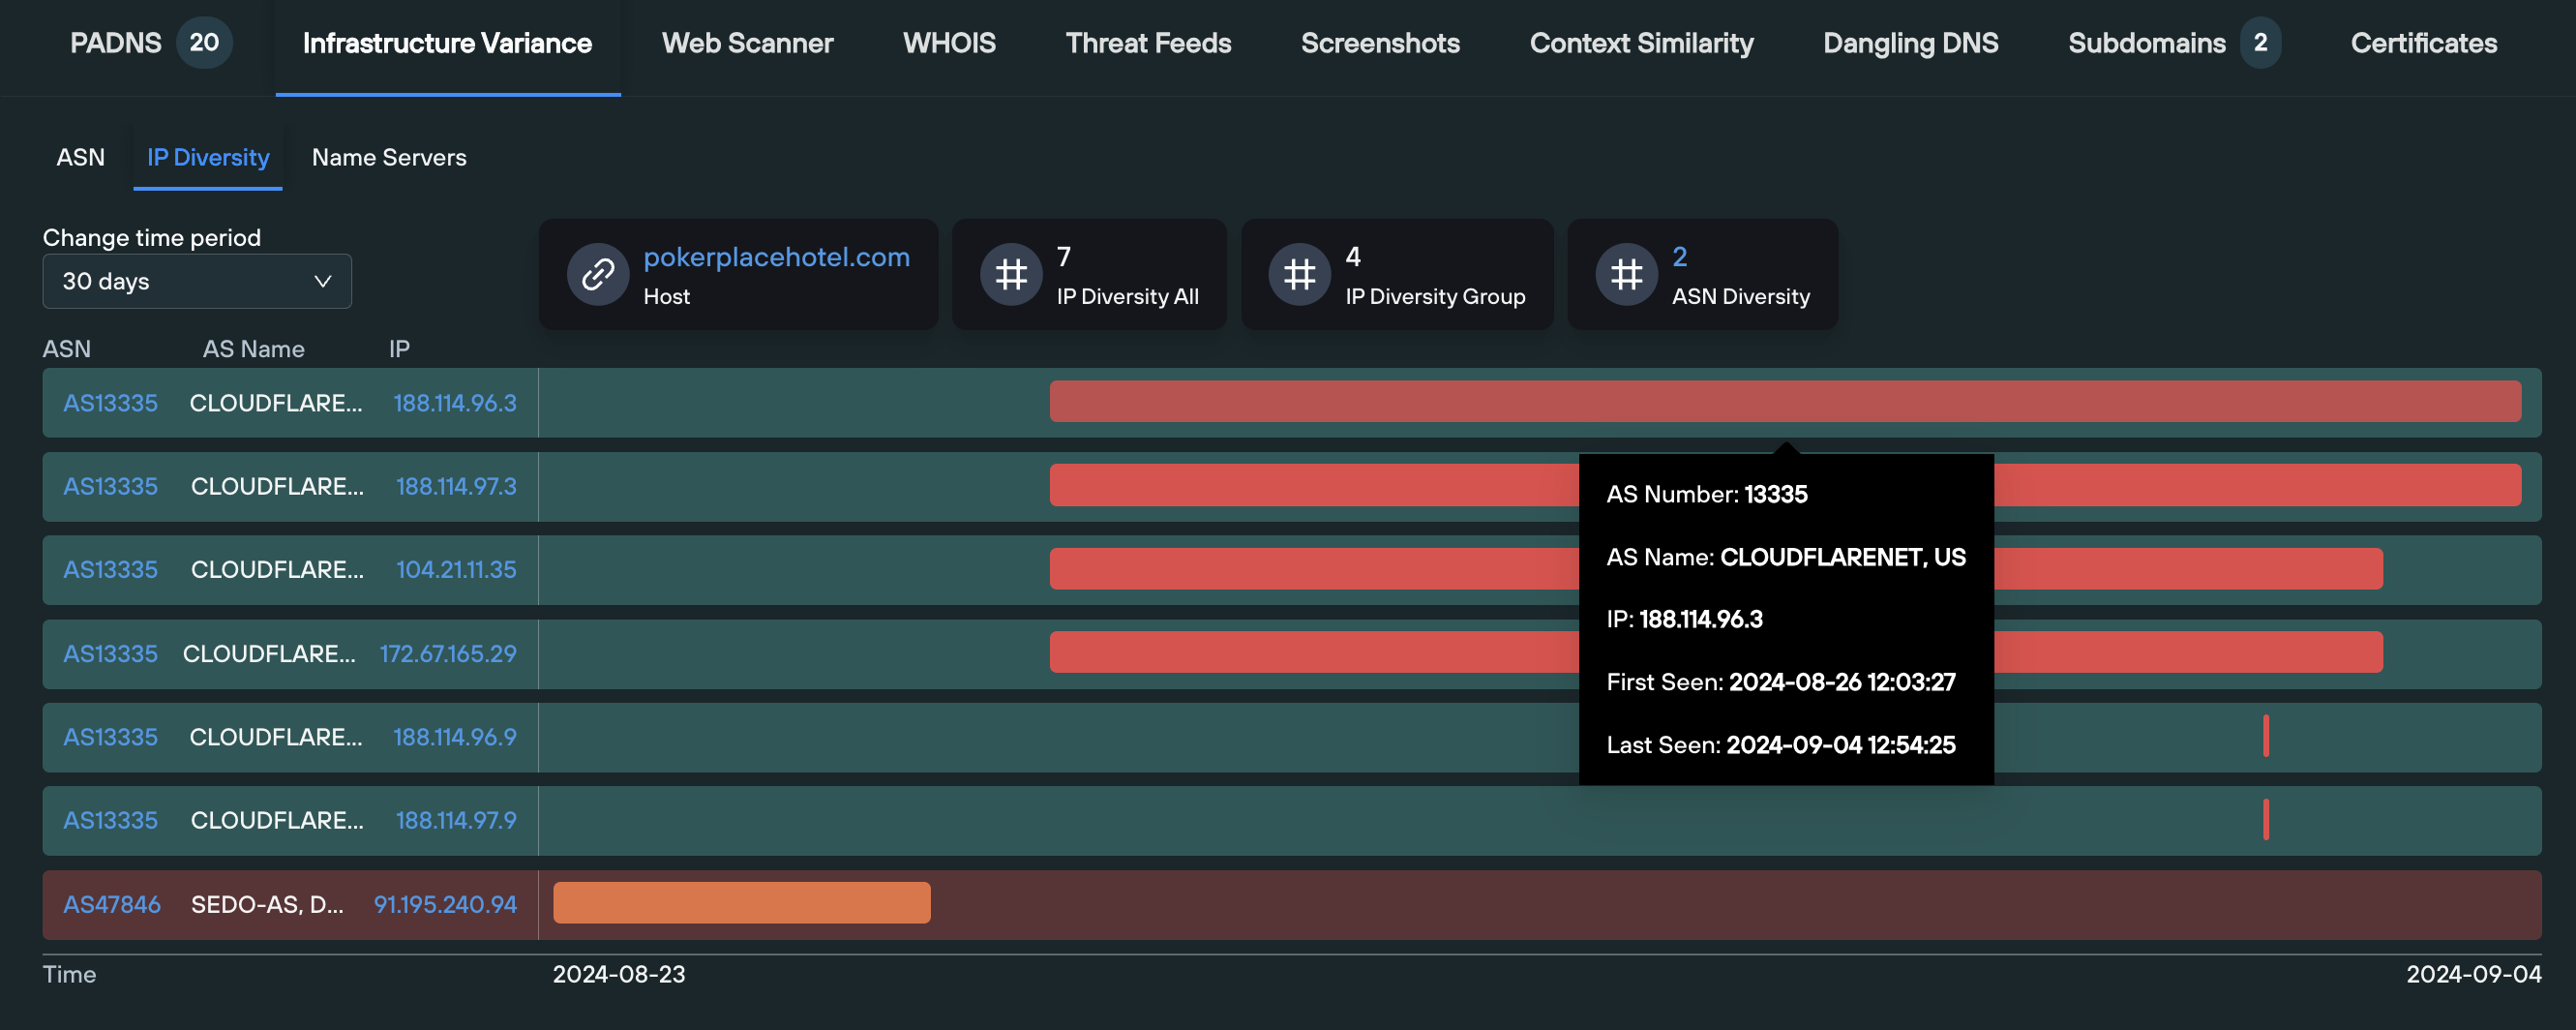
The IP Diversity tab displays both a visual and numerical representation of how the domain has moved between IP hosts over time, including the ASNs that a given IP operates on. This section is particularly useful for locating “outlier ASNs” within an organization’s public DNS presence – infrastructure hosted on an ASN which isn’t to be expected.
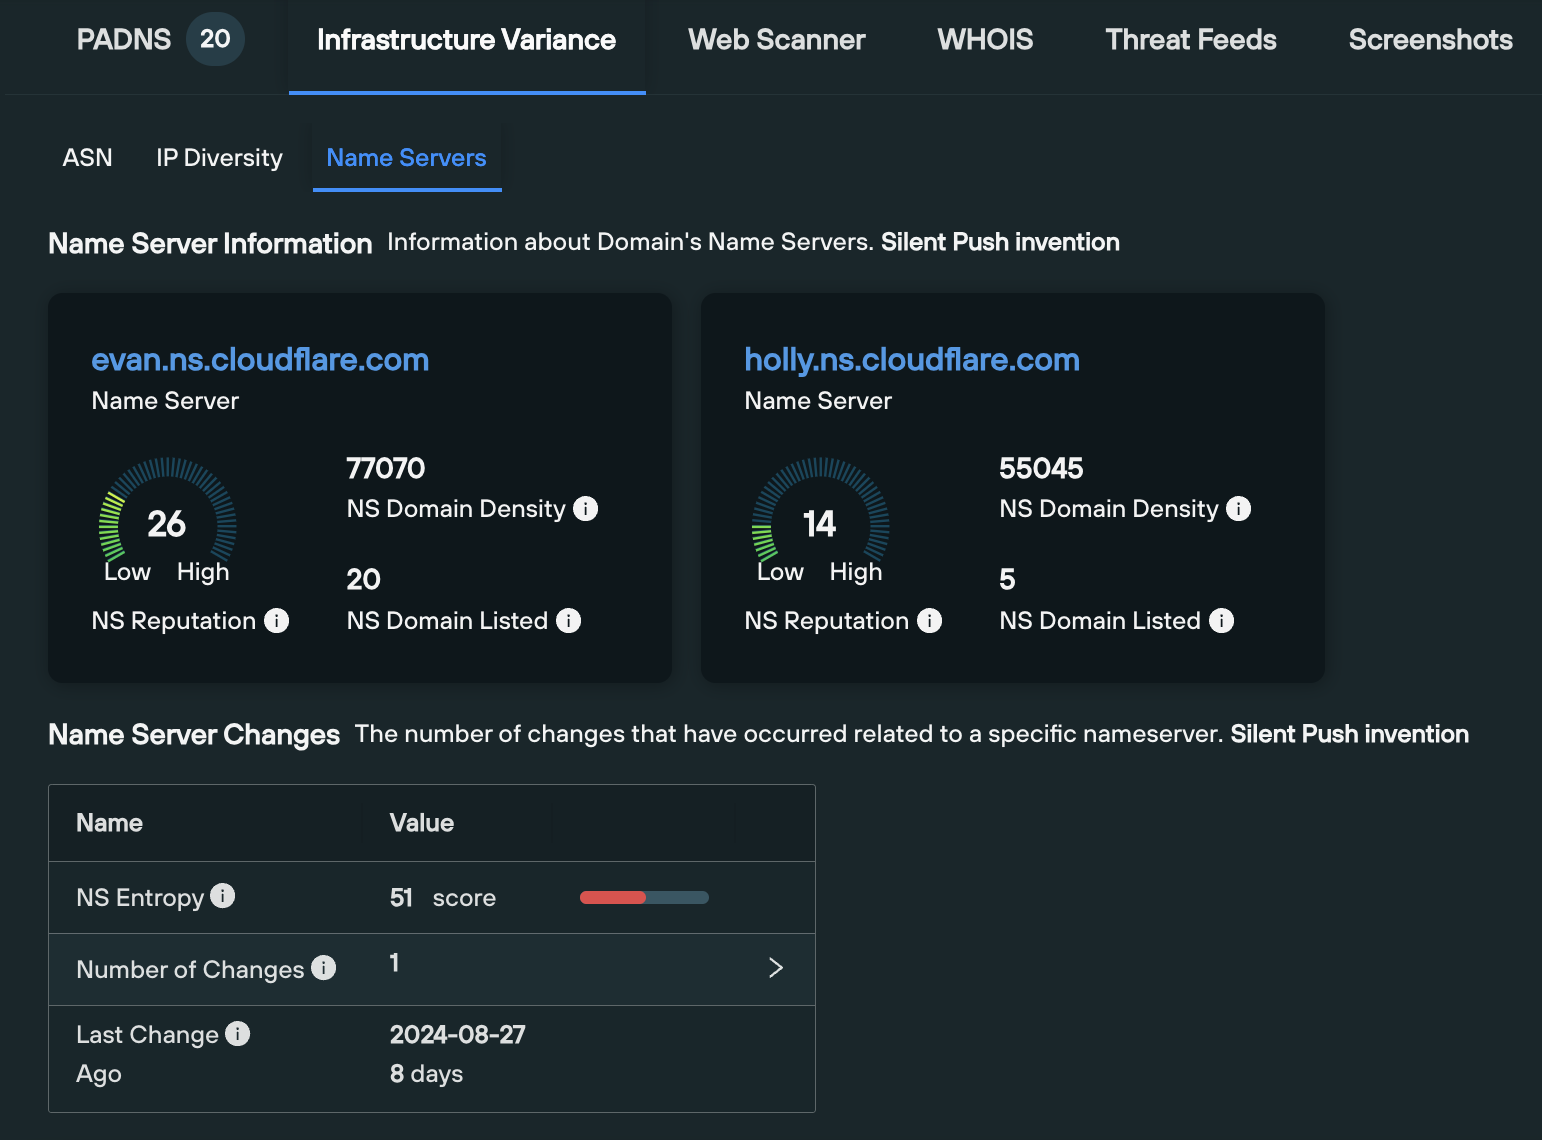
The final tab displays a wealth of information relating to each nameserver associated with the domain, including:
- Nameserver Domain Density: how many domains are used by a specific nameserver
- Nameserver Reputation Score: the number of blacklisted domains, taken from the total number of domains using a nameserver
- Listed Domains: The number of domains using a nameserver are found on feeds and/or blacklists
- Nameserver Entropy Score: a score that includes the recency, frequency, and the number of NS changes
3. Web Scanner
Query: Domains and IPv4 addresses
The Web Scanner tab automatically executes a Web Scanner query on the given domain, using the following syntax, that displays all the historic web content data that we hold on a given domain, across 100+ searchable fields:
origin_hostname = [domain] AND hostname = [domain]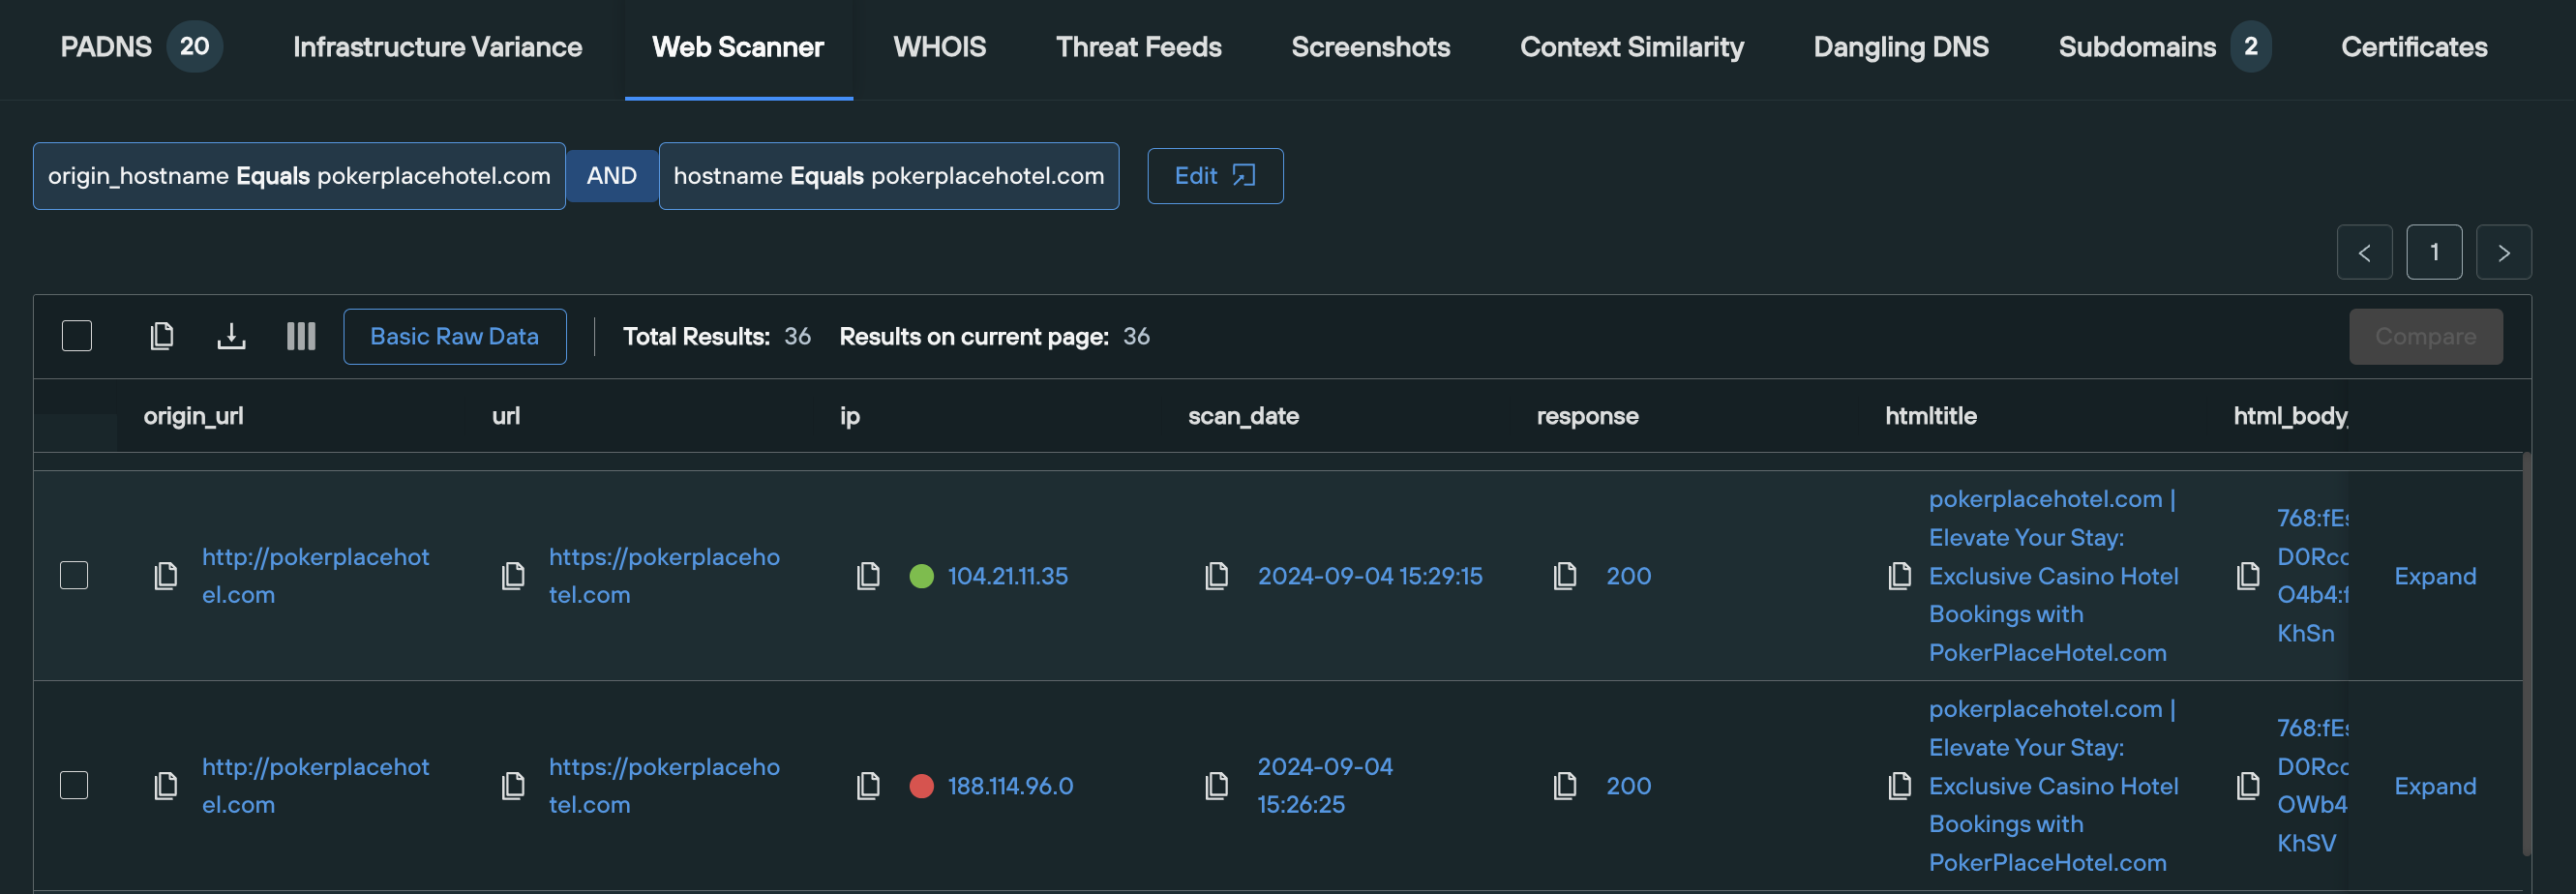
Results are displayed across the following field names:
- origin_url
- url
- ip
- scan_date
- response
- html_title
- html_body_ssdeep
- favicon_icons
- header.server
- ssl.issuer.organization
All of these fields are able to be pivoted on individually, or used to execute additional Web Scanner queries that produces a narrower set of results.
4. WHOIS
Query: Domains only
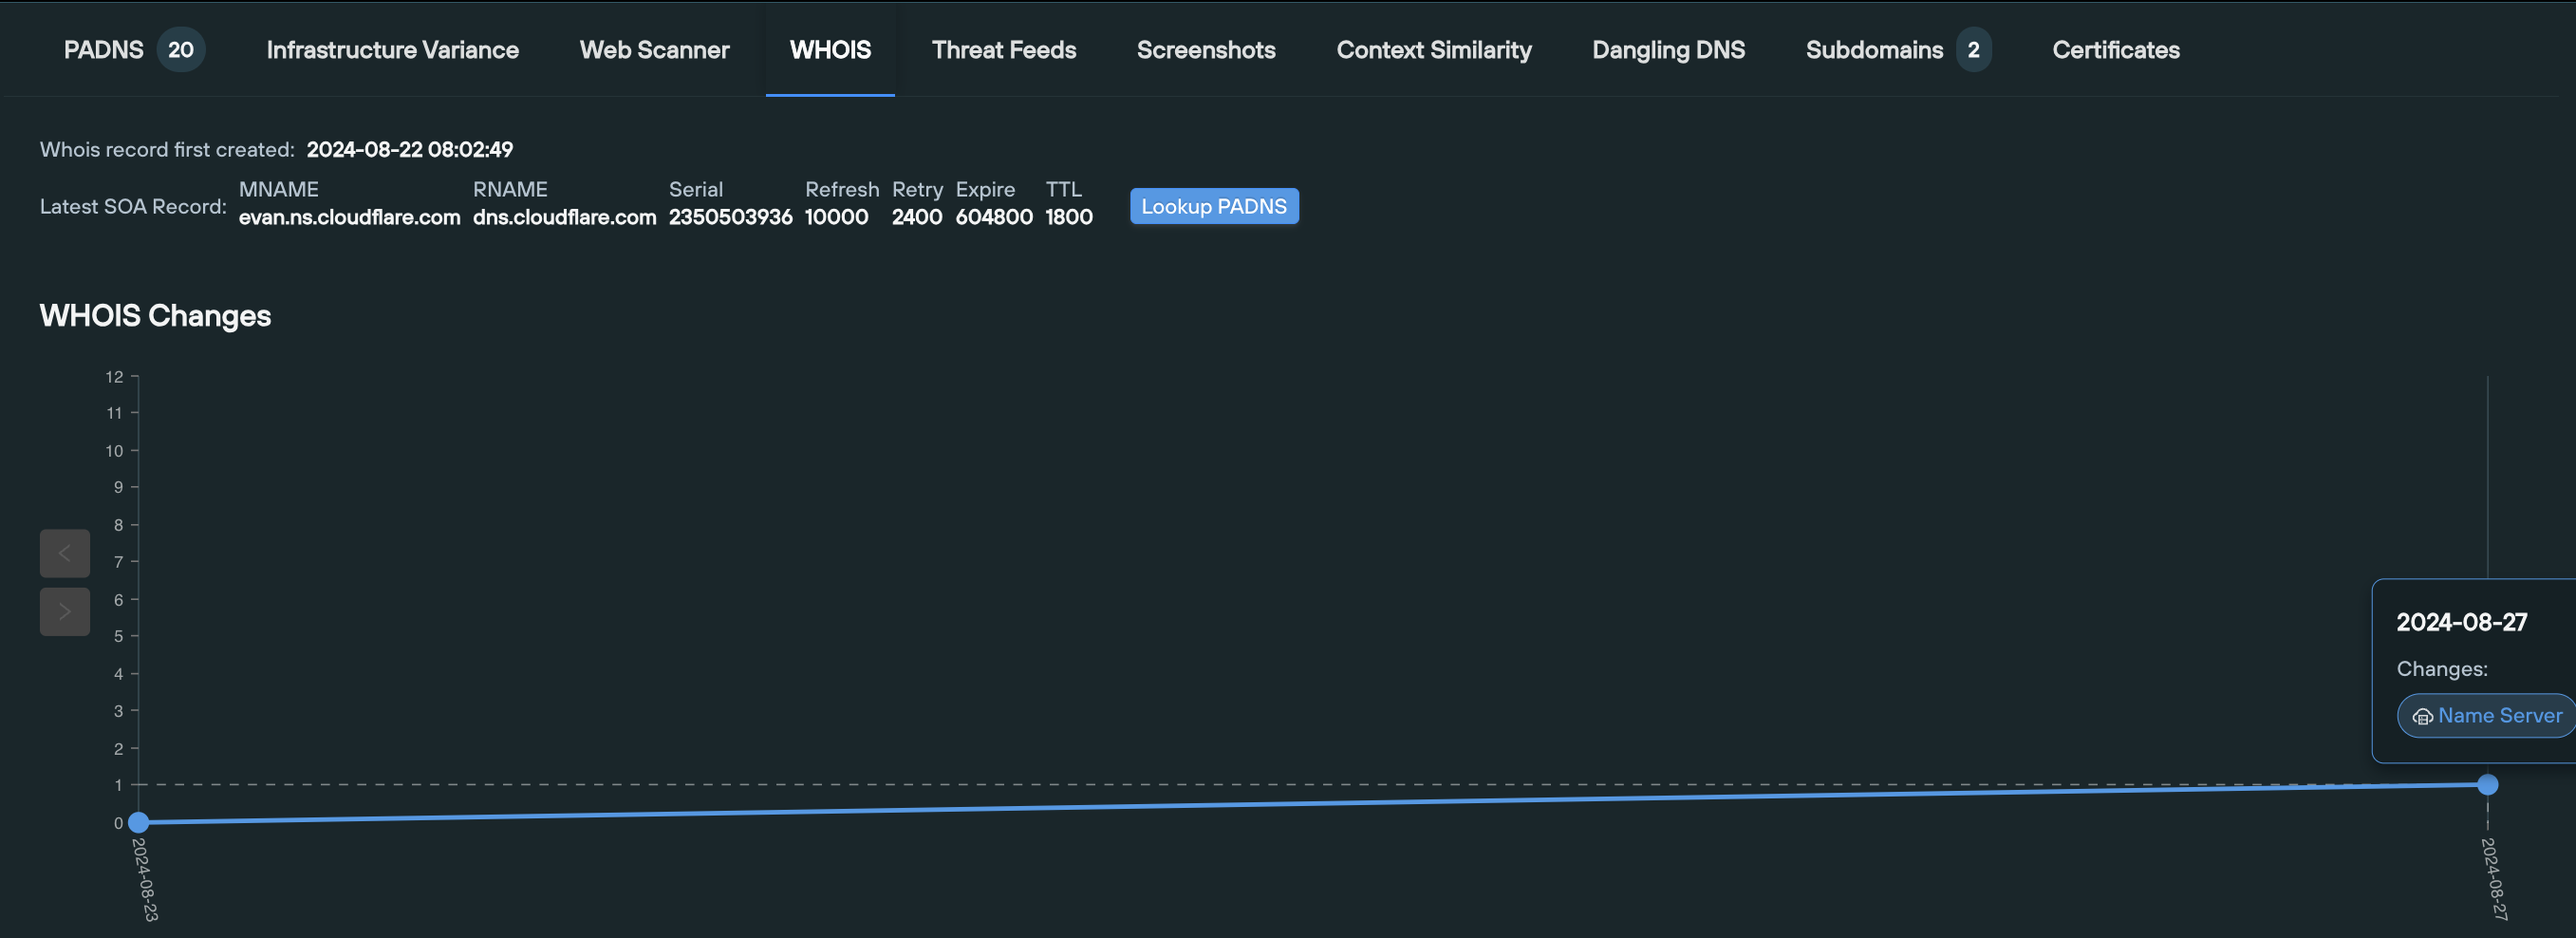
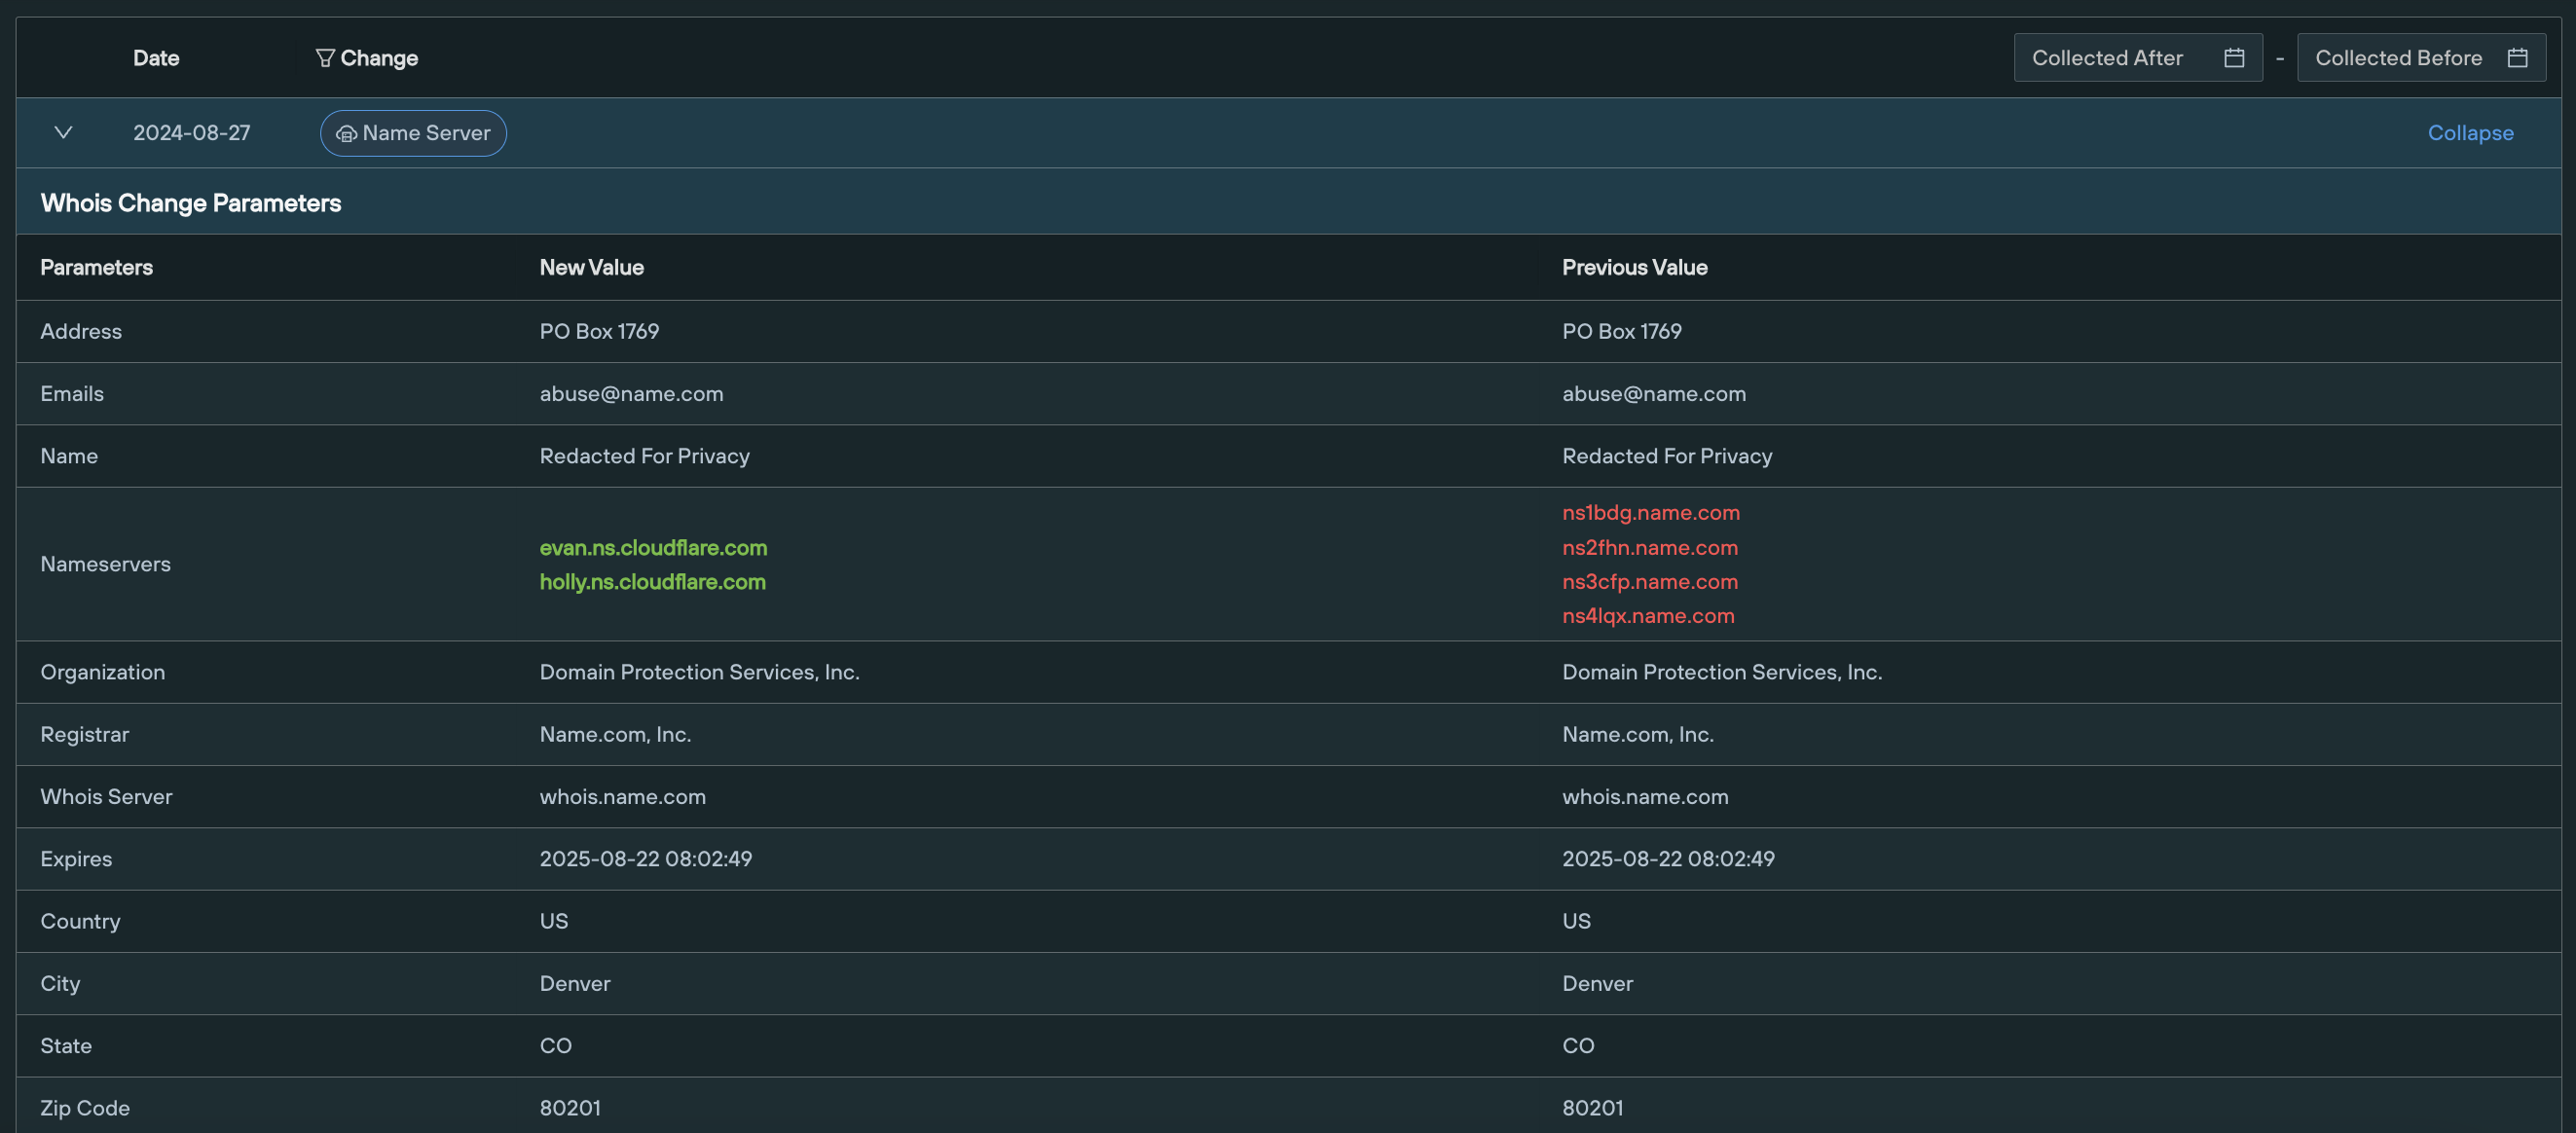
The WHOIS tab displays the history of WHOIS data related to the given domain, including a visual timeline and a tabulated view of timestamped differential changes, side-by-side.
5. Threat Feeds
Query: Domains and IPv4 addresses
The Threat Feeds tab contains two sections that display metrics relating to an observable’s existence within an IOFA Feed.
The first section – Threat Feed History – displays various data points that allows you to track a domain or IP’s presence within a given threat feed over time.

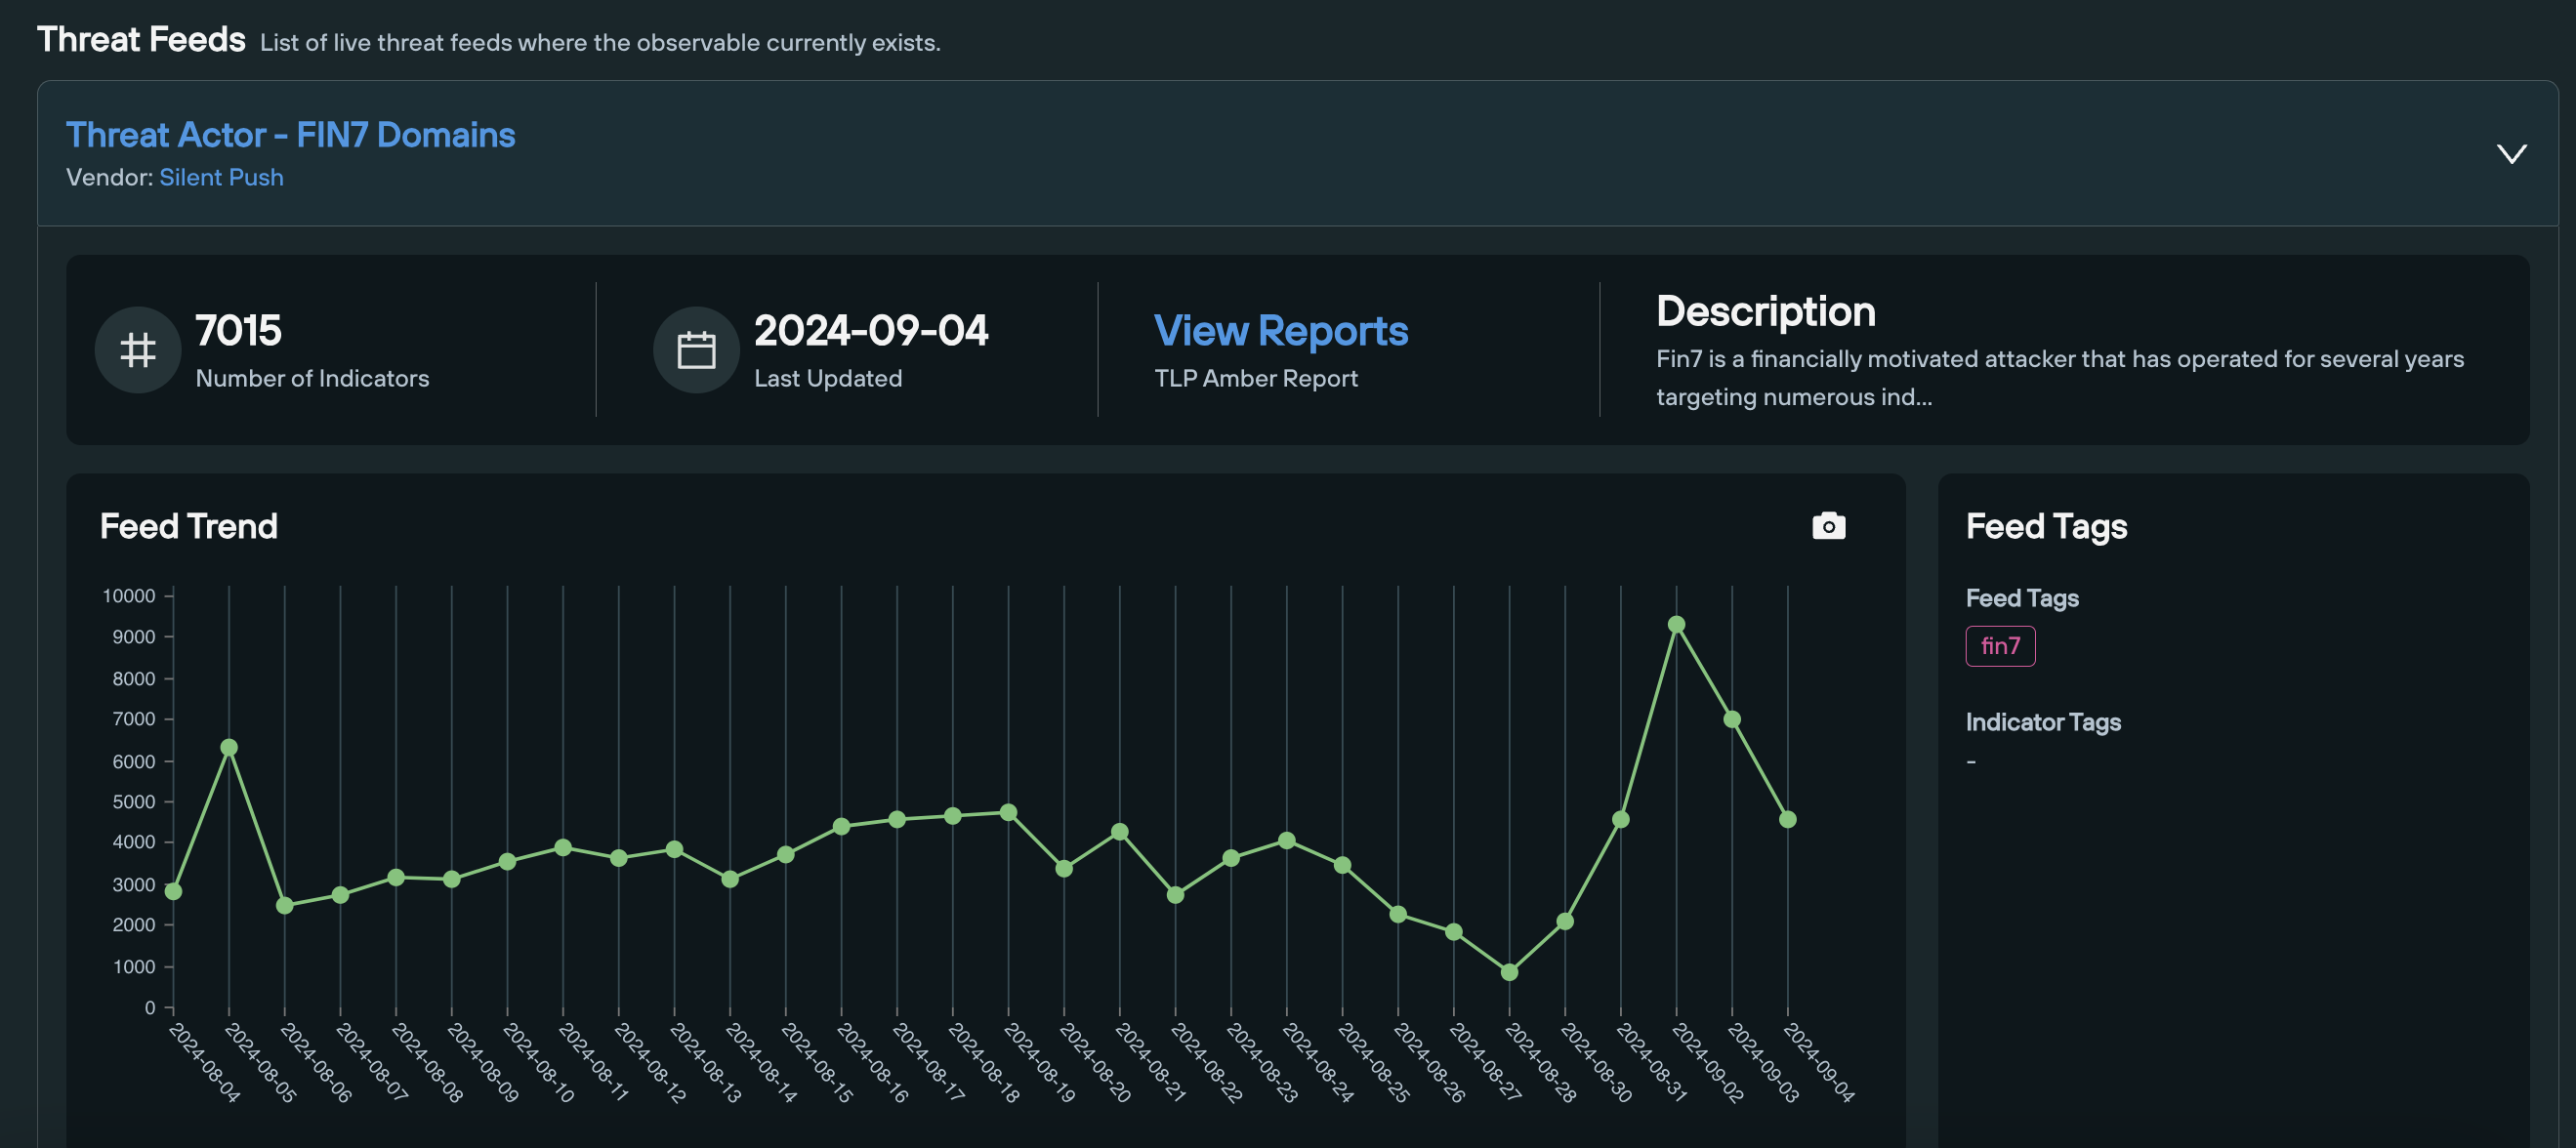
The second section provides live data on any feeds in which the observable currently exists, including a timeline of the amount of indicators, and a link to the feed’s TLP Amber report (available to Enterprise users only),
6. Screenshots
Query: Domains and IPv4 addresses
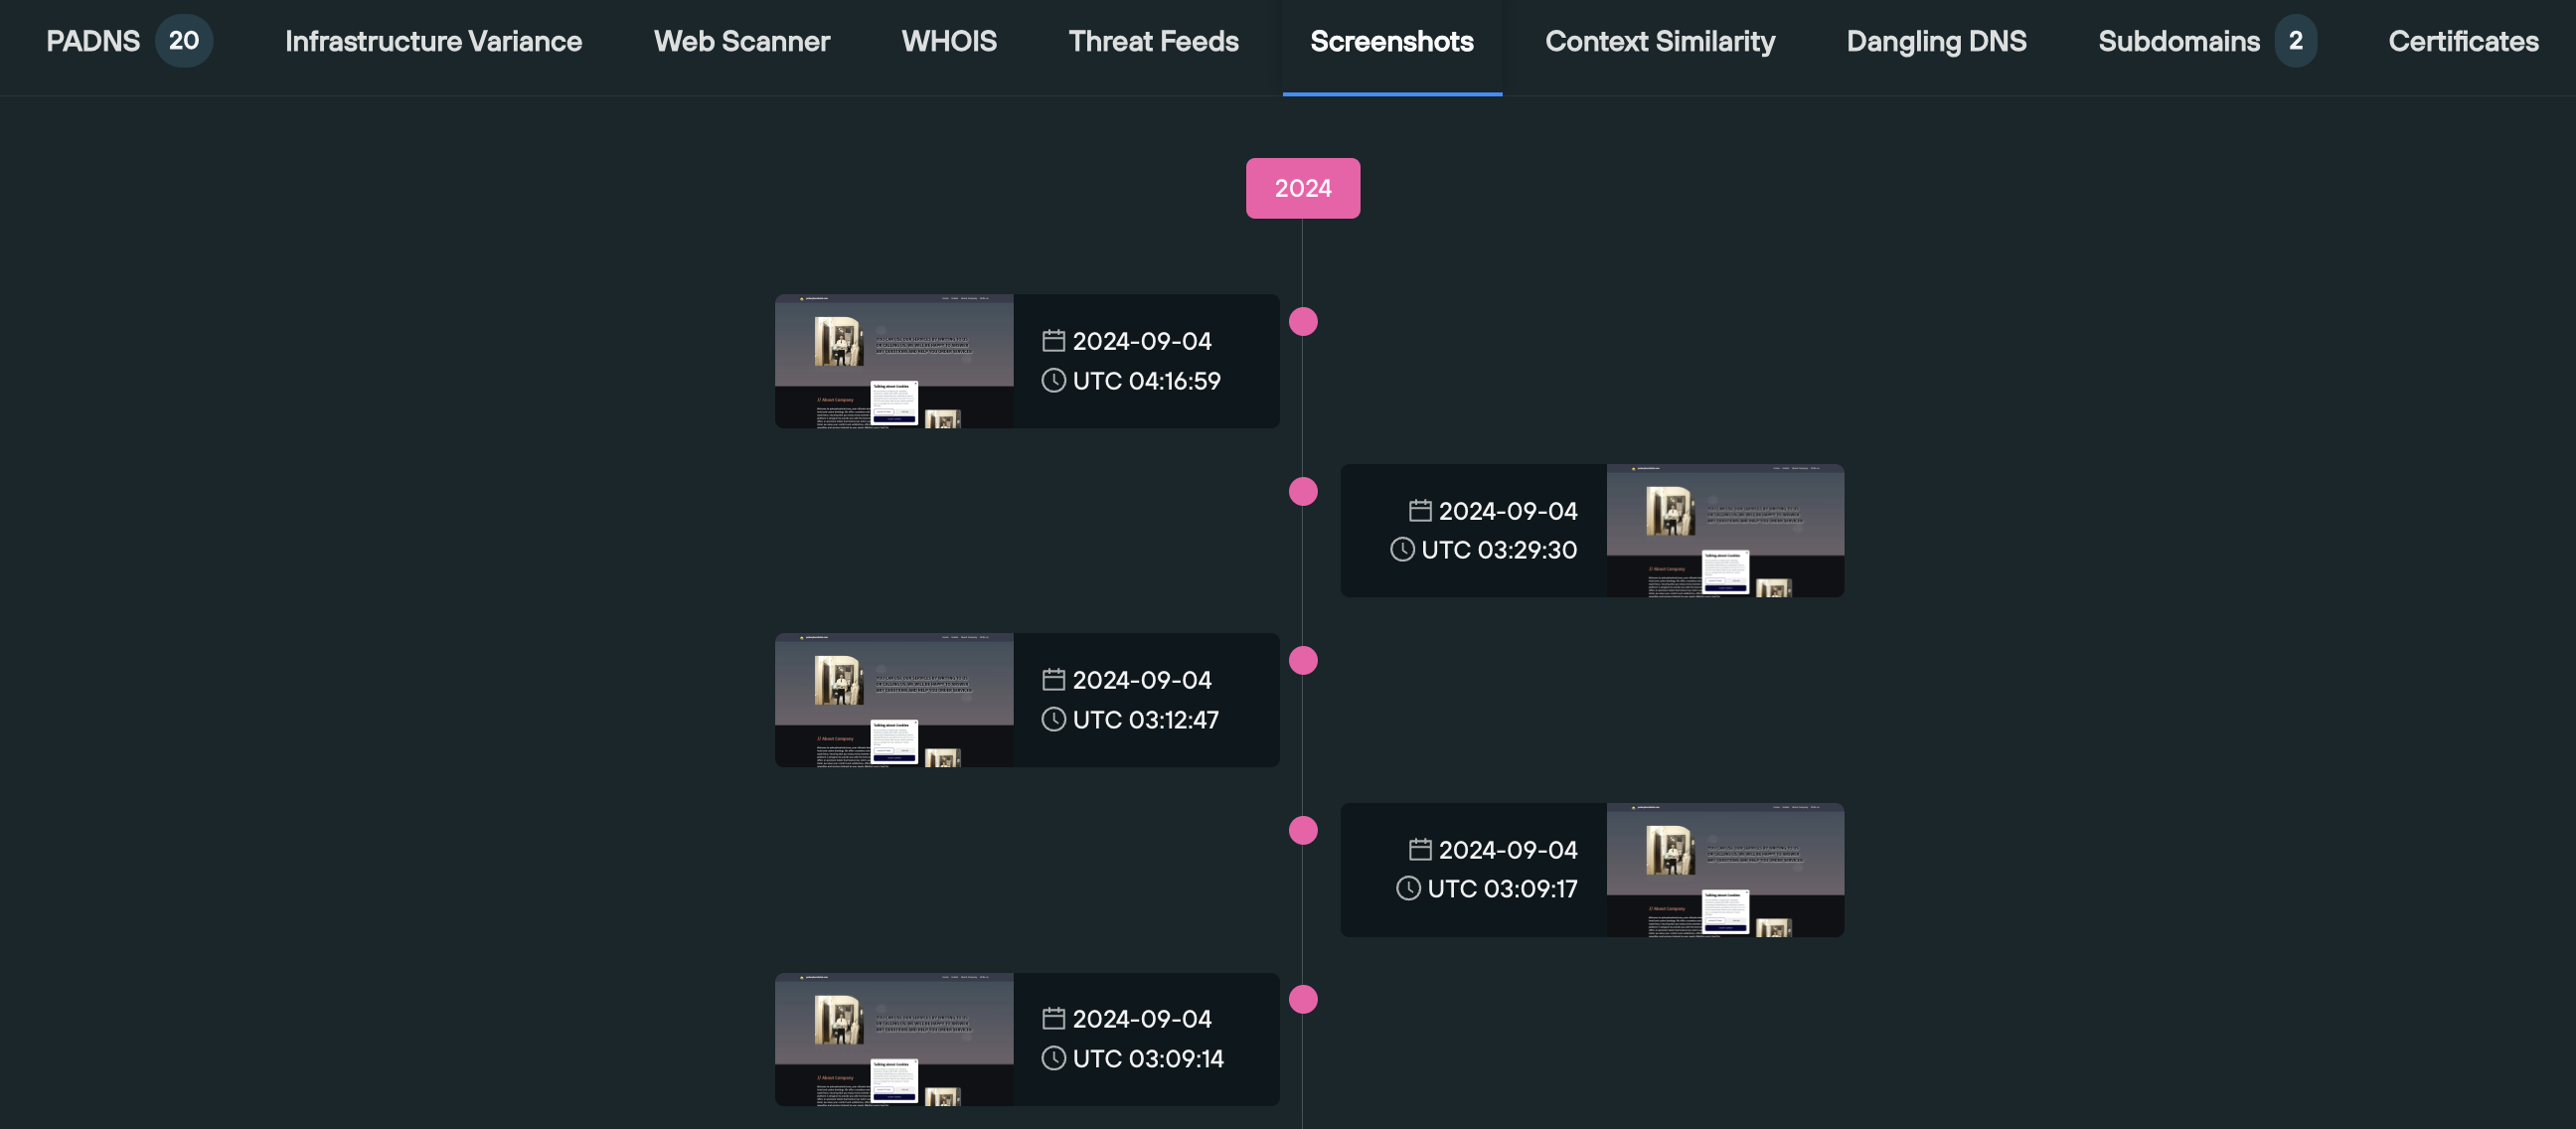
The Screenshots section is particularly useful when attempting to understand how a threat actor is recycling their infrastructure to host different pieces of content on a single domain over time, as well as establishing what’s currently being displayed to users visiting the domain or IP.
Screenshots are displayed on a visual timeline, in descending order.
7. Dangling DNS
Query: Domains only
A dangling DNS record is a DNS entry that points to a resource that no longer exists or is no longer in use. This can happen when a service is decommissioned, a domain name expires, or a DNS record is misconfigured.
Attackers exploit dangling DNS records to redirect traffic to malicious websites or services, or perform a subdomain takeover.
The Dangling DNS tab scans your organization’s domain infrastructure, and displays both a list and a count (based on your subscription level) of any records that are dangling, so that they can be dealt with immediately.
8. Subdomains
Query: Domains only
The Subdomains tab displays a list of all the subdomains associate with the enriched apex domain, allowing you to establish all the visible secondary infrastructure associated with your given domain name.

If the domain has a wildcard A record in place, you’re able to click on each record to view details of where the wildcard A record resolves to.
Results are populated on an Explore table, allowing you to set up automated monitoring that alerts you to changes in the dataset every 24 hours.
9. Certificates
Query: Domains and IPv4 addresses
The Certificates tab performs two functions – it displays a visual count of realtime certificate data (more specifically, any certificates that are due to expire, and who the certificate issuers currently are), and runs a Web Scanner query that returns data on any active certificates, across the following field names:
- ssl.SHA26
- ssl.issuer.organization
- ssl.not_before
- ssl.not_after
- IPS Scanned On
- Certificate Status
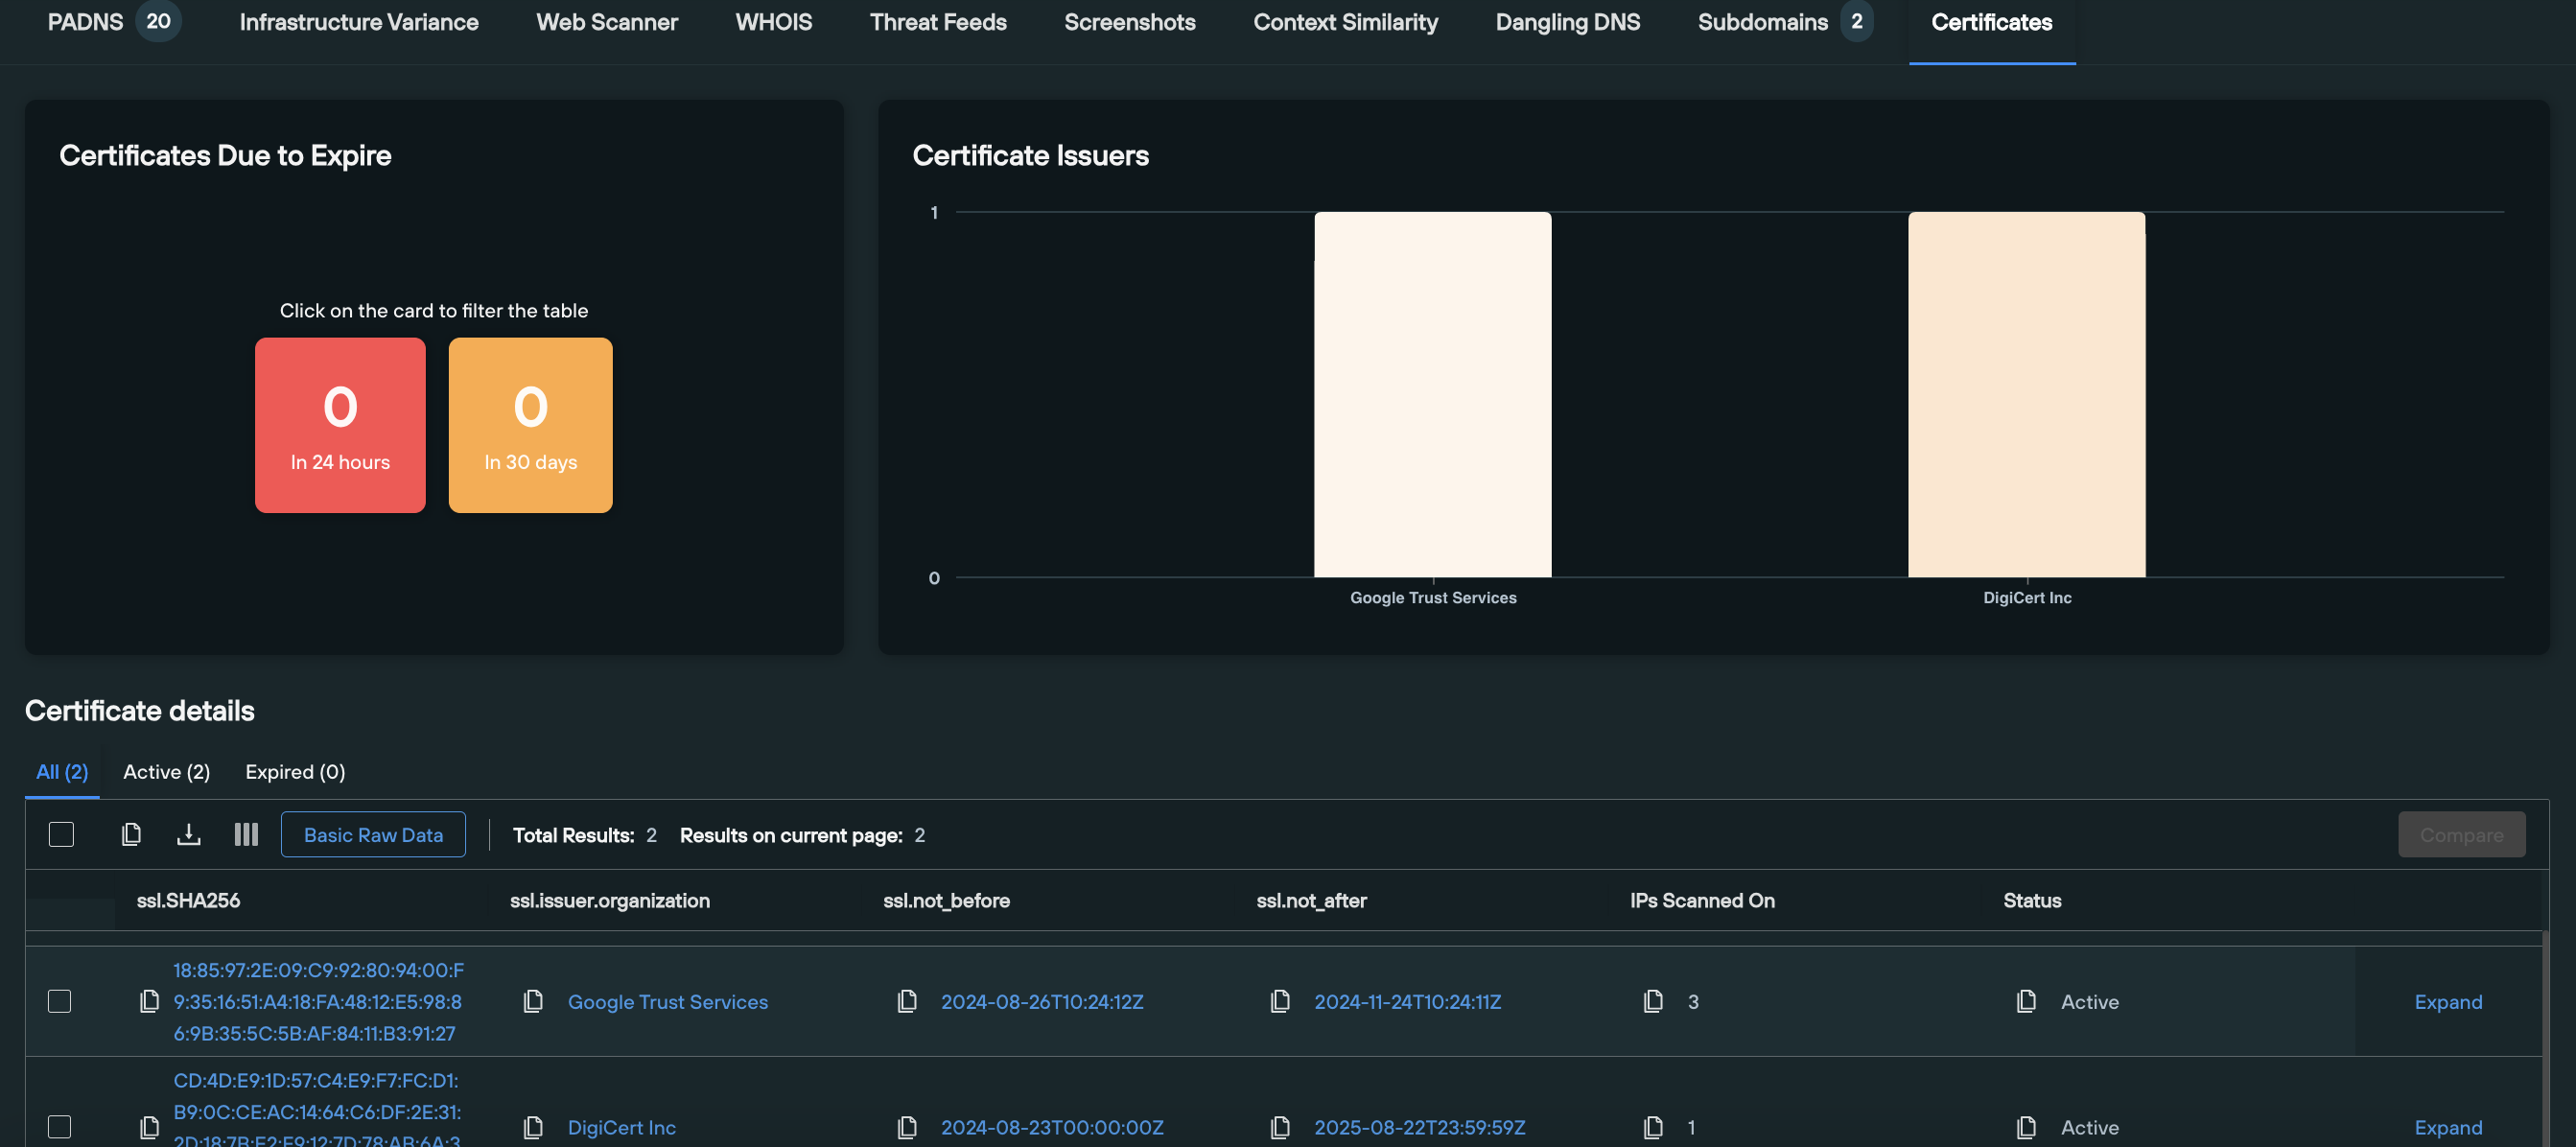
This allows defenders to obtain a real-time appraisal of how certificates are being applied across their attack surface, and gives offensive team members the ability to perform a deep dive into an observables certificate infrastructure, and locate domains or IPs that are circumventing global certificate standards to legitimize malicious infrastructure.
Register for Community Edition
Silent Push Community Edition is a free threat hunting and cyber defense platform used by researchers, defenders and threat hunters, featuring a range of advanced offensive and defensive lookups, web content queries, and enriched data types, including Silent Push Total View.
Sign-up for a free account here.


